Whether support calls for the month, sales over several weeks, or income for the past year, a line chart gives you a quick and clear view.
Line Chart Types in Excel
Open your spreadsheet in Microsoft Excel consider which chart type best fits your data. Line chart: A basic line chart for displaying several data points and when the order of the categories is key. Stacked line charts: Line charts that display changes over time for parts of a whole. 100-percent stacked: Similar to stacked but displays the percentage contribution of the parts of the whole. Line charts with markers: A line chart with markers for the horizontal access. These display fewer data points better than basic line charts. 3-D line chart: Includes a third axis to place some lines in front of the other for a 3-D appearance. If you aren’t sure which line chart type is suitable for your data, continue with the steps below to see a preview of each.
Create a Line Chart in Excel
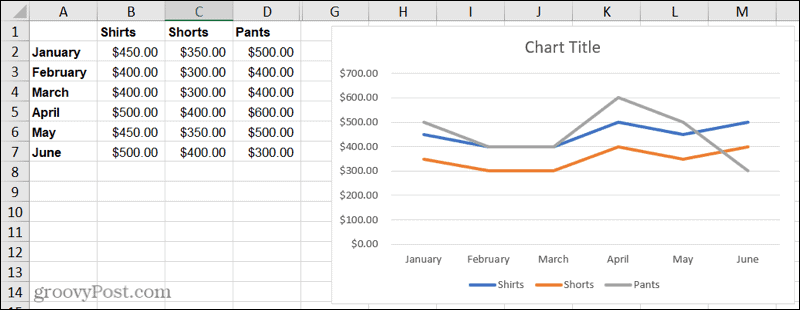
With your data ready to go, it’s time to create your line chart. For example, we’ll show product sales over a six-month period in a basic 2-D line chart.
When you select the line chart you want to use; it will pop right onto your sheet. From there, you can make adjustments to the appearance and chart elements.
Customize a Line Chart in Excel
Microsoft Excel offers a variety of customization options for its charts. And you have a few methods for making your changes. Chart Design tab: Select the chart and then click the Chart Design tab. With it, you’ll see tools in the ribbon for choosing a different layout, picking a style or color scheme, selecting the data, and changing the chart type.
Format Chart Area sidebar: Double-click the chart to open the Format Chart Area sidebar. Then, use the three tabs at the top for Fill & Line, Effects, and Size & Properties. You can then adjust fill and border styles and colors, add shadow or a reflection and resize the chart using exact measurements.
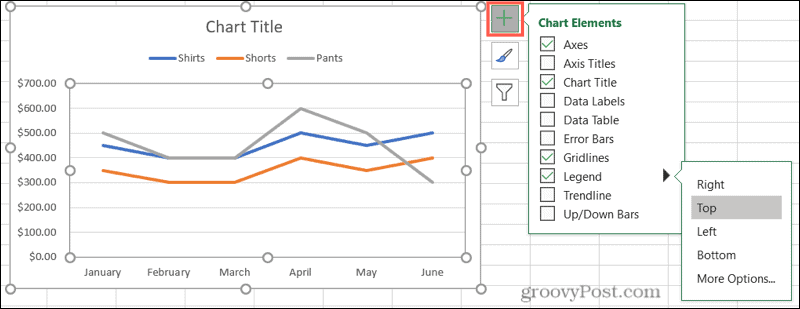
Windows tools: If you’re using Excel on Windows, you’ll see three handy buttons appear on the right of your chart when you select it.
Chart Elements: Add, remove and reposition elements on your charts, such as the legend, labels, and gridlines.
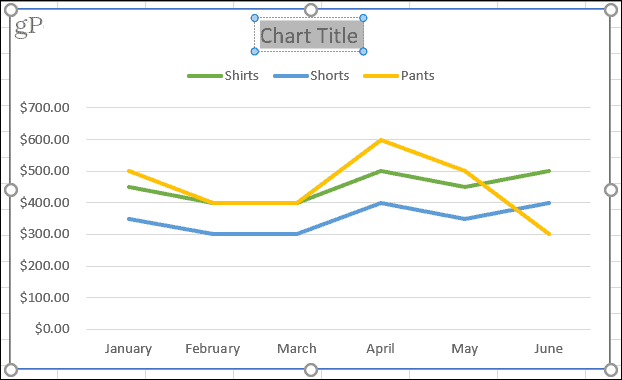
Chart Styles: Pick a different style for your chart or select a color scheme.
Chart Filters: Highlight specific data from your data set using the checkboxes.
Additional Chart Options
Select and drag your chart to a new spot on your spreadsheet to move it. Click and drag in or out from a corner or edge to resize your chart. To title your chart, click the Chart Title text box on the chart and enter the new title.
Try a Helpful Line Chart to Display Your Data
Charts are super helpful visuals that let you easily spot patterns, see similarities and differences, and get a great high-level view of data at a glance. If you want to show trending data or data over a time period, create a line chart in Excel. For more, take a look at how to make a histogram in Excel to show frequency data or how to create a scatter plot for comparing data sets. Comment Name * Email *
Δ Save my name and email and send me emails as new comments are made to this post.


![]()
